
Are you aware that according to the U.N. Food and Agriculture Organization (FAO) 95% of our food is produced directly or indirectly from our soils. In other words, soils are precious resources upon which our very life depends. Beyond food production, soils can also deliver other ecosystem services such as water purification, soil contaminant reduction, nutrient cycling as well as carbon sequestration. However, the pressures of a growing population have resulted in a higher demand for soil-related products, leading to land degradation processes such as erosion, nutrient depletion, chemical contamination, acidification, and salinity. Therefore, the biggest question for scientists is: how to ensure the sustainable production of the soil ecosystem services especially those in relation to food security? The answer to that question lies in a more sustainable management of soil resources.
Sustainable management requires accurate and detailed spatial soil information to inform decisions. As this popular saying from the management guru Peter Drucker goes, “If you can’t measure it, you can’t manage it.” Soil data will help answer questions such as: How well is the soil doing? Is it well or poorly managed? Which actions need to be taken to improve its current state? My research has been focusing on how to add value to soil measurement by translating them into digital soil maps that can show the spatial distribution of a specific soil property at any location of a given landscape. This blog post very briefly presents a case study focusing on Benin republic (West Africa) where some soil property maps were developed and were further integrated into a soil fertility soil map using a digital soil mapping approach.
In Benin, access to soil testing laboratories are very scarce and it is therefore difficult for farmers to know the fertilizer requirements of their soils. A soil fertility maps has been lacking in the agricultural sector leading to inadequate strategies for soil fertility and fertilizer management. The current fertilizer recommendations are standard for all soil types across different geographical regions which however have specific characteristics. This leads to imbalanced application of plant nutrients and fertilizers which in turn affect negatively both crop yields and soil health. This is where digital soil mapping is worth considering.
Digital soil mapping (DSM) refers to the application of mathematical and statistical methods for soil mapping. DSM combines information from soil observations with information contained in explanatory factors and provides soil maps as output. The general approach of DSM is based on the scorpan model which states that the soil attribute to be predicted is a function of other soil properties (s), climate (c), organisms (o), relief (r), parent material (p), age (a), location (n).
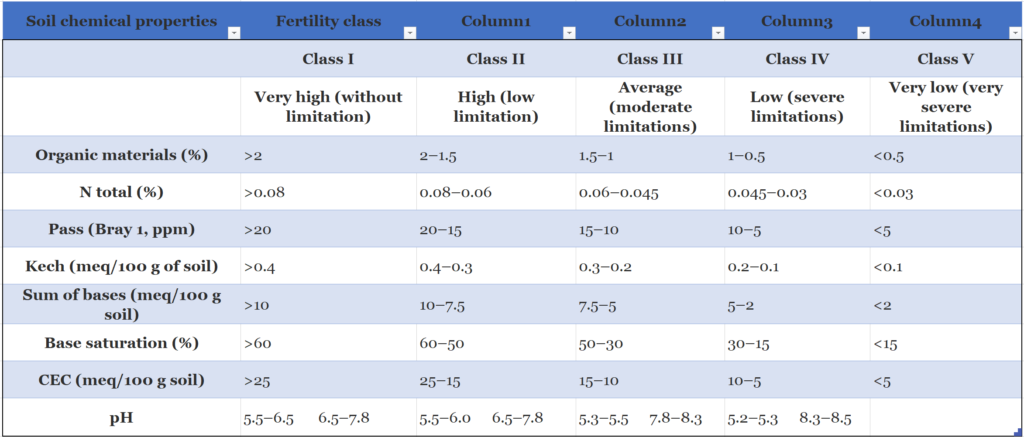
The application of DSM at Benin scale resulted in the production of eight soil property (soil organic matter, total nitrogen, assimilable P, exchangeable k, cation exchange capacity, sum of cations, base saturation and pH) maps which were integrated to produce a soil fertility map for the topsoil (0 – 20 cm) of the agricultural land. This soil fertility map is based on 5 classes which took into account previous studies on the Benin agricultural landscape. A brief description of the five chemical fertility classes considered in the study is as follows (see table):
- Class I, very high level of fertility: soils presenting no limitation, optimal condition for crop growth and yield.
- Class II, high level of fertility: soils presenting slight limitations, referring to situations that could slightly reduce yields without, however, demanding special cultivation techniques.
- Class III, average level of fertility: soils presenting moderate limitations, referring to situations that cause a greater decrease in yields or the implementation of special cultural techniques.
- Class IV, low level of fertility: soils presenting severe limitations, referring to situations that cause yield reduction or the implementation of cropping techniques that adversely affect the profitability of the production system.
- Class V, very low level of fertility: soils presenting very severe limitations, referring to situations that do not allow the use of the land for production.
Evaluation criteria of the classes of chemical fertility
The resulting soil fertility map shows that that most of the agricultural lands of Benin belong to the low fertility class, presenting severe limitations for cropping. This is mainly due to the low organic matter content in these soils with farmers removing or burning most of their crop residues while a high temperature leads to a faster decomposition of organic matter. The high decay rate of organic matter results in soils with low level of nitrogen, which becomes a limiting factor in most agricultural soils. In addition, the rapid growth of Benin population resulted also in the reduction of fallow periods which in turn led to the decline of soil organic matter content. The low level of nutrients in Benin soils makes additional supply as fertilizers necessary for a higher productivity of the croplands. However, a limited number of soils with high and average fertility levels are also present especially in the upper North and Southern part. The use of such areas could be cautioned again soil sealing which is the irreversible process that leads to the destruction or covering of soils by construction and urban infrastructure especially in a context where Benin is working towards national food sufficiency.
Though this study presents the spatial distribution of soil fertility classes at Benin scale, the uncertainty related to the predictions was not evaluated. This further step will be necessary to inform end users on the quality of the map especially for areas where predictor values are beyond reference data. Making decisions on extrapolated areas will not be as accurate for areas where data were available. However, the current fertility map provides first hint of the soil status while additional information (soil texture, soil biology, or missing chemical data etc.) could be added to fully check local situation. In addition, policy makers have a support for understanding that fertilizer recommendation should be different for areas with low fertility class compared to those of average or high level of fertility.
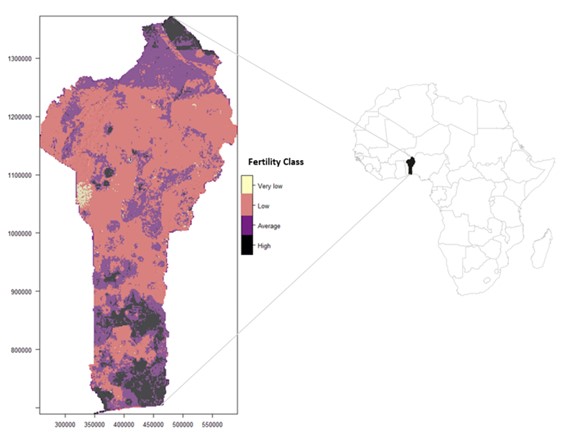
Soil fertility class distribution in Benin

Ozias Hounkpatin holds a Ph.D. in Soil Sciences. He is affiliated with the Water and Development Research Group at Aalto University. Currently, he works as postdoc and focuses on identifying feasible and sustainable food system opportunity to meet the future food demand by assessing how soil conservation and nutrient management strategies impact on food production globally and its feedback on e.g. erosion, GHG emissions and biodiversity.