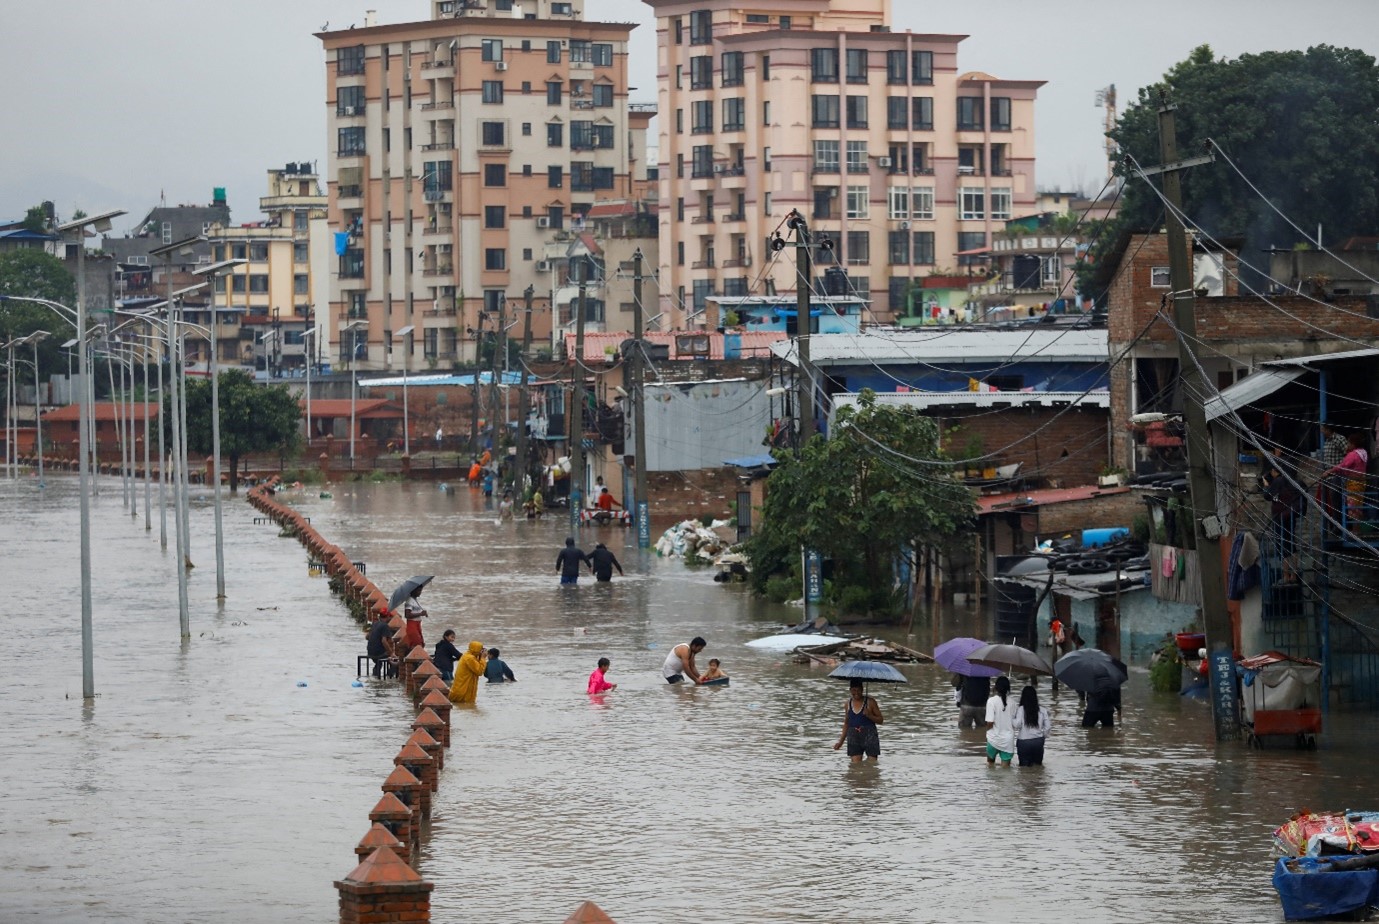
Fig: People walk along a flooded road along the bank of overflowing Bagmati river following heavy rains, in Kathmandu, Nepal August 8, 2023. Photo: Navesh Chitrakar, REUTERS 2023.
Floods are amongst the devastating natural hazards around the globe. When there is rise in water level in rivers (“riverine floods”) or water entering the cities due to poor drainage (“urban floods”) or rise in sea level (“coastal floods”), the people and properties lying in those regions are vulnerable to the damaging effects of flood. Those communities are susceptible to loss of life or their properties or disruption of their daily living when flood events take place. As millions of people are affected by flood events every year, it is very crucial to understand the risk associated with the floods before the events take place. This process referred to as Flood Risk Mapping (FRM), includes mapping of the areas susceptible to floods of different magnitude.
FRM is done before the actual events for possible scenarios of floods which helps the decision makers to plan for minimizing the loss to the vulnerable communities. A well validated FRM can save lives of thousands of people during the events, but it requires several datasets like climatic (rainfall, temperature, evaporation), hydrological (flow in the river), ground topography, historical records of floods and their impacts to model and map the flood events. In this regard, some or all these datasets might not be available which simply defines the situation of data scarcity. In general, having no data at all refers to data scarcity however researchers also advocate data scarcity as having limited/sparse amount of data gathered through surveys, national records, or satellite observations, depending on the scope of the research. The climatic and hydrological datasets are collected through ground observation stations. The more the number of these stations, better the understanding of nature of floods and their probable impacts. This is challenging in many developing countries since these stations are sparsely distributed. Thus, these countries often rely on freely available data which are collected from satellites (called remote sensing data) having global coverage as a source of data to map floods and their risk. However, the question is whether these data are sufficient to fully understand the flood dynamics, flood risk and its distribution in space.
FRM has therefore proved to be the efficient tool to communicate the risk, given that there is sufficient topographical and hydro-climatical data to model the flood events and understand the flood dynamics and spatial distribution of flood risk. However, FRM is challenging for researchers especially in the areas where there are limited or no data at all- in other words, data scarce areas.
The use of remote sensing data in FRM is rapidly increasing in data scarce areas. As these data are collected from satellites, there are uncertainties associated like cloud cover when images are taken, effect of vegetation which affects the topography for which image processing and validation through field observation is mandatory (which are often not recorded). Two or more satellites monitor the earth; however, these satellites take hours or days to return to the same location after an image is taken (known as satellite orbit cycles). In this case the floods which last for few hours are often missed by these remote sensing data. Furthermore, available ground stations might be swept away during flood events and need repair due to which there are lots of missing data during that period. For example, a ground station (installed 20 years ago) which records flow in river is swept away by flood 3 times in 20 years and it took 1-2 months each time to repair. Despite of having sufficient data for 20 years we will have the missing data for the time when repair take place. This will affect the accuracy in modeling flood risk. Thus, researchers often agrees that data can be scarce even when there are enough data with substantial missing data. Therefore, it’s not only about the quantity of data but also the quality of available data. In this case researchers have tried to integrate the remote sensing data with ground observation data to solve the problem of missing data.
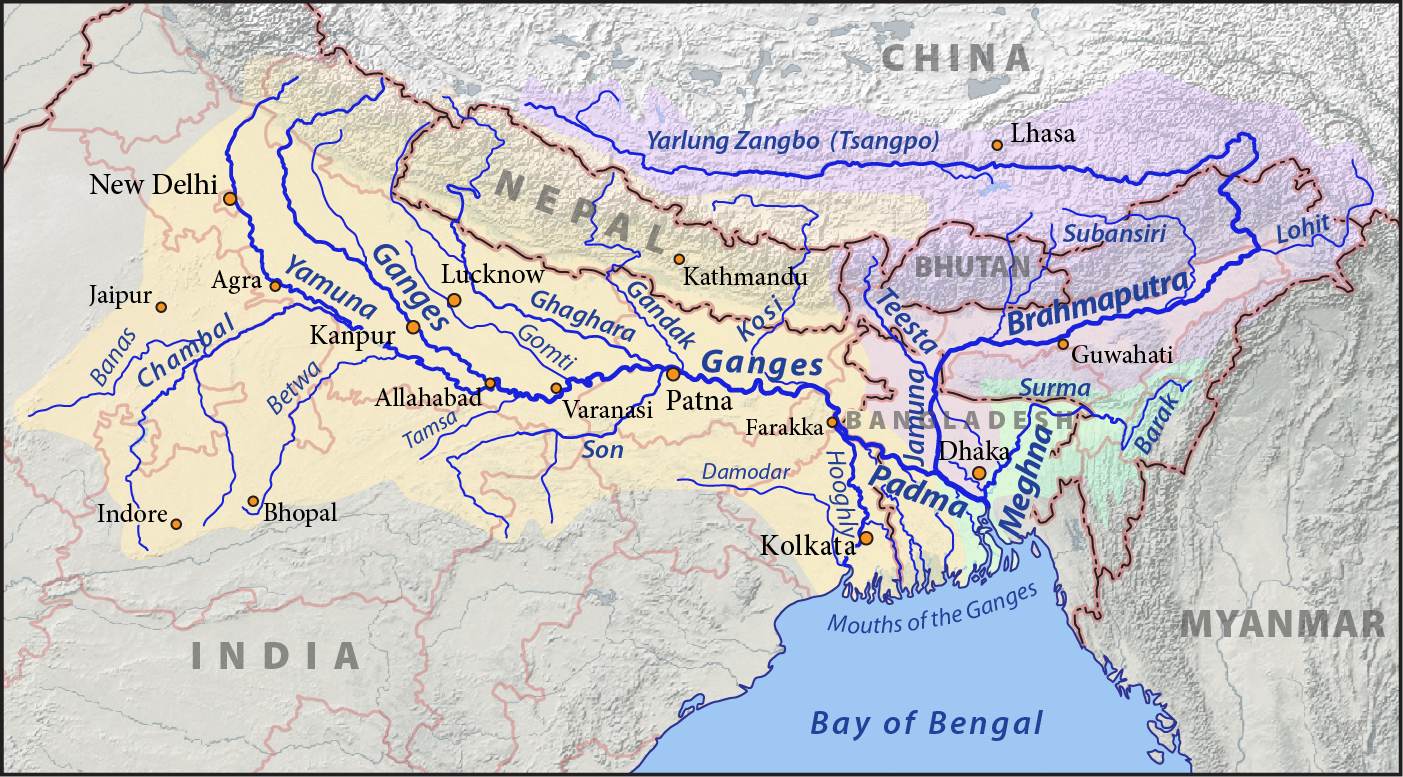
Another dimension of data scarcity researchers have perceived is associated with geographical boundaries. The transboundary nature of the rivers poses significant challenge in flood risk mapping. The figure below shows the transboundary rivers Ganges, Brahmaputra and Meghna rivers which flows through Nepal, Bhutan, India, and Bangladesh. To map the flood risk for Meghna or Brahmaputra River in Bangladesh it is important to understand the flow mechanism in the upstream rivers in Nepal, Bhutan, and India. Thus, modelling flood risk in the downstream areas require sufficient data for the tributaries river in the upstream which might be a problem when neighboring/upstream countries don’t have such data or have restrictions in sharing due to security reasons. Researchers have pointed out this issue in their studies, underscoring its significance in flood risk mapping.

Fig: An example of the transboundary nature of Ganges, Brahmaputra and Meghna rivers. (From the article: Transboundary Rivers of South Asia – The Case for Regional Water Management).
Thus, mapping flood risk presents a formidable challenge when the necessary data is absent or limited. Determining when you have sufficient data for flood risk mapping is a multifaceted process that involves assessing the types, sources, and quality of available data, as well as considering the specific context of the study area and the goals of the mapping project. It requires a delicate balance between the resources available and desired level of accuracy and confidence in the results to achieve data sufficiency. In present context of climate change, flood risk maps should be kept up-to-date and reliable which can be done through regular updates and collection of ongoing data. As the role of flood risk maps to save the lives of people from flood events have been highlighted in several research, the acquisition of even modest quantities of data holds considerable advantages to update the flood risk maps. For this, civil citizens are taking training and helping to collect data voluntarily which is important source of information to validate the model and acts as input for further mapping. These approaches have the potential to reduce the challenges posed by data scarcity, enhancing our ability to develop comprehensive flood risk maps to protect lives, property, and the environment in flood-prone areas.
References
- Abdelkader, M. M., Al-Amoud, A. I., El Alfy, M., El-Feky, A., & Saber, M. (2021). Assessment of flash flood hazard based on morphometric aspects and rainfall-runoff modeling in Wadi Nisah, central Saudi Arabia. Remote Sensing Applications: Society and Environment, 23, 100562. https://doi.org/10.1016/j.rsase.2021.100562
- Amarnath, G., Matheswaran, K., Pandey, P., Alahacoon, N., & Yoshimoto, S. (2017). Flood Mapping Tools for Disaster Preparedness and Emergency Response Using Satellite Data and Hydrodynamic Models: A Case Study of Bagmathi Basin, India. Proceedings of the National Academy of Sciences, India Section A: Physical Sciences, 87(4), 941–950. https://doi.org/10.1007/s40010-017-0461-7
- Hurtado-Pidal J., J.-P. F., Triana J. S. A. ,. Espitia-Sarmiento E. (2020). Flood hazard assessment in data-scarce watersheds using model coupling, event sampling, and survey data. 12(10). https://doi.org/10.3390/w12102768
- Sahraei, R., Kanani-Sadat, Y., Homayouni, S., Safari, A., Oubennaceur, K., & Chokmani, K. (2023). A novel hybrid GIS-based multi-criteria decision-making approach for flood susceptibility analysis in large ungauged watersheds. Journal of Flood Risk Management, 16(2), e12879. https://doi.org/10.1111/jfr3.12879

Anup Shrestha is a doctoral researcher at Water and Development Research Group, Aalto University. His research interests include hydrological processes, flood mapping, and disaster risk management.

