When we think of water networks, we usually imagine either pipes underground or rivers flowing and connecting through the landscape. But there are also social networks, which not only refer to face-to-face and personal relationships, but also connections between actors, and even relations between social and ecological systems. Although sometimes we are aware of these networks implicitly, there are ways to describe and analyse these networks explicitly through social network analysis (SNA). This blog post very briefly scratches the surface of SNA and its applicability in water governance research. It’s based on an article in preparation, and therefore doesn’t include detailed results.
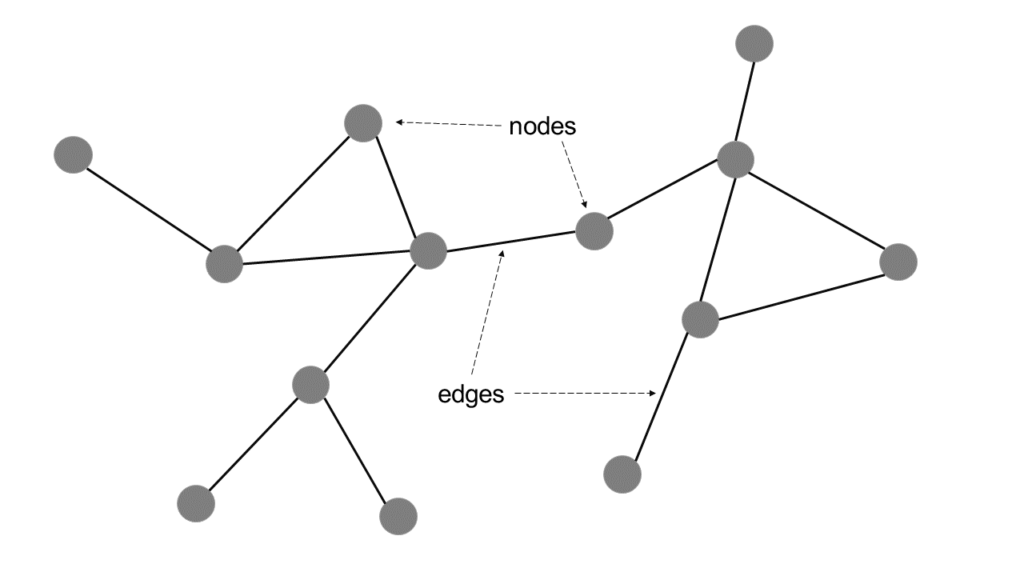
A (social) network is made of nodes and edges. In water governance network context, nodes can be used to represent any actor such as organizations, individuals, or even nations. The edges between them can represent basically any type of relationship: cooperation, hierarchy, information flow etc. Depending on used data and selected methods, the edges between nodes can be directed or undirected, or they may have quantitative or qualitative properties. An example of a network is shown in Figure 1.

Figure 1 An example of a simple network
Social networks can be analysed on node level, substructure level, and network level. Focusing on nodes can tell us, for example, how a certain actor is connected to others and what type of role or position they occupy in their network. Analysis of substructure is used to reveal communities or “cliques” within the network. And finally, network-level metrics can describe how connected overall the network is. All three levels of analysis have their own metrics, but the most commonly used is the node-level metric of centrality. Centrality tells us – well – how central a node or an actor is: how many connections it has (degree centrality), how “far away” it is from other nodes (closeness centrality), or how often an actor is between other actors (betweenness centrality).
These metrics are not useful by themselves; only by contextualizing them we can discover and draw conclusions. With insight and context, they can be linked, for example, to collaboration, adaptive capacity, policy positions, and brokerage roles. Additionally, they can reveal how different levels governance interact or overlap, or who control the flow of information.
In my own research I have applied SNA to Finnish flood risk management plans (FRMPs). By combining all FRMPs it was possible to construct a network containing all actors responsible for or participating in flood risk management measures. A part of the network is shown in Figure 2, where each node is an actor, and edges represent common measures between actors. Although not finished yet, the initial results are interesting as they indicate new roles of some actors, and the methodology used may be applicable to broader context in the future.

Figure 2 A part of the actor network derived from the Finnish flood risk management plans
SNA is an interesting method (or a set of methods) to complement existing water governance research. It has become more and more relevant as flood risk management and flood risk governance are moving towards solutions that usually require the collaboration of multiple stakeholders, and traditional top-down governance is giving way to more collaborative, networked settings.
Featured image: Photo by Alina Grubnyak on Unsplash
Author bio

Thomas Banafa is a doctoral candidate at Aalto University’s Water and Development Group. He holds an MSc (tech.) in Water Resources Management. His doctoral research focuses on collaborative water governance. In addition to his research, Thomas is as an independent consultant and an entrepreneur working in flood risk management with both with public and private sector clients.
Twitter: https://twitter.com/ThomasBanafa
LinkedIn: https://www.linkedin.com/in/thomasbanafa/
Banafa Consulting: https://www.banafaconsulting.fi/

